Step 2.1: Did you said time series?
You are not alone in your quest, exoplanet hunter! As your personal assistants, we will teach you some basics knowledge to help you achieve this awesome quest!
First, to begin your training, let start with the introduction of the NASA data modelised as time series.
Star’s data
During this tutorial, you will study the NASA Kepler data-set. You will be in charge to discover some exoplanet by analyzing photometry from differents stars collected by Kepler.
You will be working on the photometric series called SAP_FLUX (Simple Aperture Photometry fluxes). It represents the flux in electrons per second contained in the optimal aperture pixels collected by the spacecraft. This is the raw data acquired by Kepler. Here’s an example:
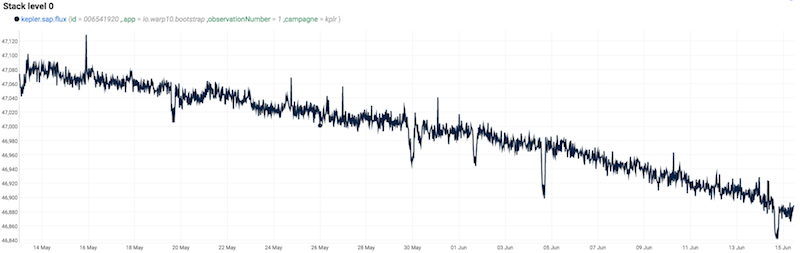
As the lightcurve of a star evolve according to time, it can be considered as a time series.
What are time series?
A time series is a sequence of evolving values over time. These values, named datapoints or measurements, are added as they come, with a stable frequency or not.

To ease readability, let’s visualise it with colors instead of degrees values. We can then use the Celcius degree as an Y-axis to graph the temperature evolution along the day.
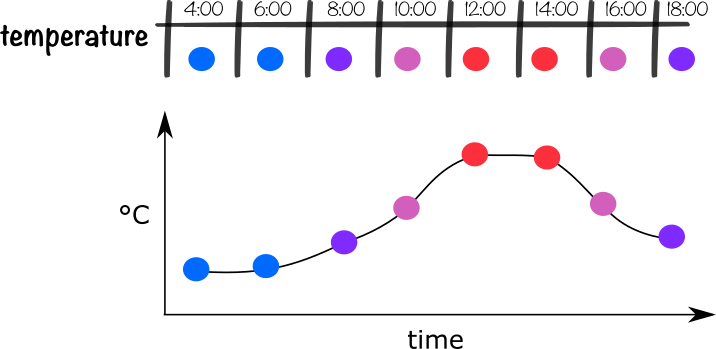
Like in this small example, a graph with a value in an axis, and a time in the second one is just a time series visualisation.
Where can we find time series?
Time series are everywhere, here are just few examples:
- The evolution of the stock exchange
- The number of calls on a webserver
- The fuel consumption of a car
- The load of a CPU
- The time customers are taking to register on your website
- The time they spent on your website
- The heart rate of a person measured through a smartwatch
Time series data model
We call the magnitude measured in the time series classname. In the previous examples, the classnames could be dollars, calls, gallons, percentage, time spent or heart rate
In the draw above, we have considered a simple series measuring temperature. There are situations where the measured magnitude (temperature in pur example) will not be enough to qualify your series. In a home you could measure temperature at different places like :
- outside
- room 1
- garage
- 1st floor room
- kitchen
- etc.
This why we need labels (or tags, dimensions,…) to enhance the data modeling. And now our data model looks like :
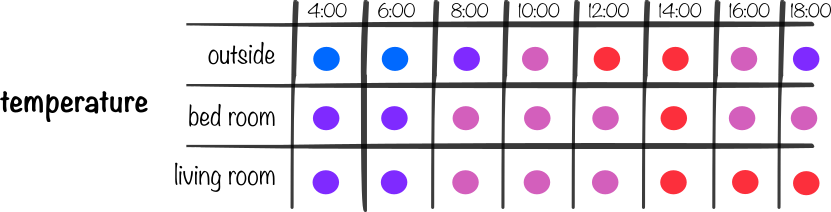
Labels are key/value pairs used to qualify series. They are immutable, which means if you change something in the labels set, it won’t affect the previous series but it will create a new one. This also means that your time series data model need to be designed carefully.
Given the many aspects they can have, the storage, retrieval and analysis of time series cannot be done through standard relational databases, like SQL. Instead it needs a custom built system, not only a time series Database, but a whole solution that will enable usability of the data.
We can find here and there many time series Databases that claim to solve the same storage system but most of them fail in their mission to provide you the right tools and protocol to let you enjoy your data.
Time series values
Once you have define the good time series model for your own need (in the case of monitoring, most of the time your collecting software will choose it for you), you will push data points or measurements.
These data points can be of multiple types (Long, Double, String, Boolean) given the protocol you use. You can refer to the matrix compatibility to know which one fits you best.
Time series analysis
While a common use case for time series is to plot them as a graph, using line charts or sparklines, many customers will need to perform custom analysis on their time series for domains like :
- Statistics, TopN
- Signal Processing
- Pattern Detection
- Anomaly Detection
- Approximation (like regressions)
- Classification
- Prediction and Forecasting
- etc.
There have been a lot of research effort around time series analytics, as they are a powerful tool to modelize complex and critical processus. Today we have many algorythms specifics to the time series, as AutoRegressive Moving Average (ARMA), AutoRegressive Integrated Moving Average (ARIMA) or Dynamic Time Warping.
And, of course, you can combine thise specific techniques with generic statistical or signal processing analytics.
Time series applications
There are two main kinds of time series applications:
- Understanding the data: analysing the time series in order to explain why and how the data behavior
- Fit a model: creating a model fitting the data, and using that model to do things like monitoring (detecting if the data received fits to the expected) or forecasting (predicting the future data behavior).
But why would we use Warp 10?
Warp 10 is one of the multiple currently available time series databases. It also includes the WarpScript language (saw in the previous step), a language dedicated to time series manipulation.
And What does a time series looks like in WarpScript?
If you type the following WarpScript code:
You will push on top of the stack a time series. A time series follow this modelisation:
- It requires a fix classname (the key “c”) in quantum result, which is the main identifier of a time series (string).
- The labels “l” also identifies the existing series. This corresponds to a map object of string key/values.
- The attributes “a”, same as Labels but they are global parameters of a series and can evolve without creating a new series.
- And finally the values “v” which includes a timestamp (time of the current point), a location and a value (can be Double, Long, Boolean or string)
To update any of those parameters, you can use one of the following functions that updates the initial time series to define an example one: the number of time a spefic planet rotates!
This will leave the initial time series created on top of the stack, updated with each different values.
To be continued
Luckily for you all the needed time series for your exoplanet quest are already available in our back-end! We will now start exploring them.